TL:DR
Command Files allow you to start up gdb in a way that saves you typing the same commands over and over, even doing some of the ‘driving’ for you. I’m not suggesting that this is the best way to use gdb but I found it really helpful and I saved a bunch of time. I’m blogging it for my own reference and to help others find a lesser known, but very useful feature of the tool.
Background
While working on the SLAE64 course assessments, I found myself jumping in and out of gdb a lot. Constantly rebuilding and refining my shellcode test binaries meant that I ended up in constant cycle of doing a whole heap of setup in gdb to get things the way I wanted them, only to spend a few seconds debugging the target, then quitting, tweaking the code, rebuilding and repeating the whole process again.
I’m not a great typist, but I keyed in this sequence so many times that I could probably do it in my sleep:
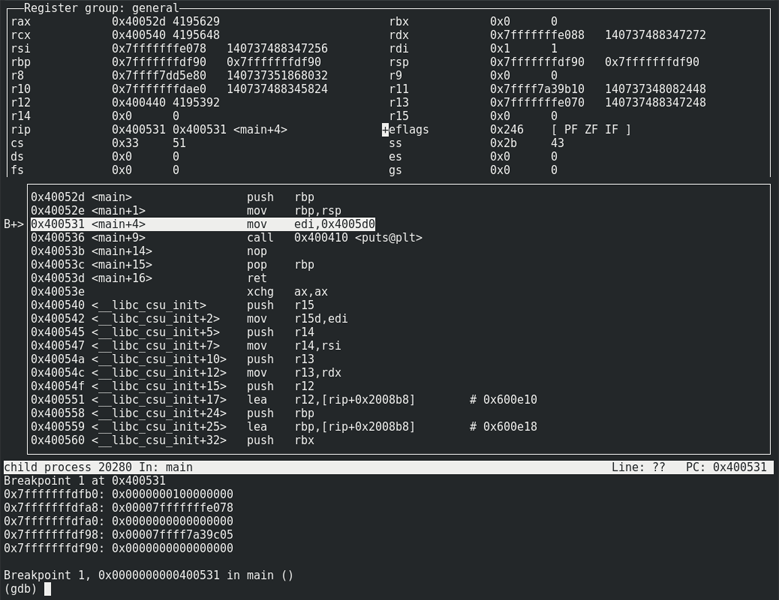
layout asm
layout reg
break _start
run
There has to be a better way.
User Config
There is a mechanism to customise gdb so that it starts up in a useful state; the .gdbinit file. At startup, gdb looks in your home directory for a .gdbinit file and executes any commands it finds there. This is the normal method for deploying extension tools like PEDA and is also great for those commands that you end up typing often, like set disassembly-flavor intel.
This method applies the config to every run of gdb, so you cannot get too specific with the things you set here.
Local Config
After loading the global config, gdb will look for a .gdbinit file in the working directory. This allows a per project configuration to be automatically loaded. This is great for getting a little more specific, however, in my case I had a bunch of binaries in one directory and was doing a few different things with each one. What I really needed was a selection of canned command sequences that I could choose from when I started gdb
Command Files and the -x Switch
By using the -x switch, you can specify a command file to be run as part of the gdb start up. This file is just a .gdbinit file with an arbitrary name. The structure is the same, it’s just a list of commands for gdb to run.
Here’s one I use as a starting point for for poking around gcc binaries:
# Sensible asm plz
set disassembly-flavor intel

# Lie about screen size to prevent paging stops
set height 0

# Invoke register and disassembly windows
layout asm
layout reg

# Set the keyboard focus back to the command window.
# This allows the up key to access command history.
focus cmd

# Size the command window to display more of the disassembly view
winheight cmd 5

# Size the register window save space
# (windows of 114 cols will show all registers in two columns)
winheight reg 14

# Define a command to show the stack in a useful way
define stackdump
	set $offset=32
	while $offset > -1
		x/gx $rsp+$offset
		set $offset=$offset-8
	end
end

# Dump the top of the stack at each break
define hook-stop
	stackdump
end

# Set up relevant breakpoints
break main

# Start the target
run
To use the command file, start gdb like this:
gdb -x cmd_file target_file
This work fine for Ubuntu, but on CentOS, the TUI mode has to be specified on the command line or the display falls apart after a few refreshes:
gdb -x cmd_file -tui target_file
The result of this command sequence is a nice general purpose debug environment that dumps the top of the stack after each step.
It springs into life fully formed and you don’t have to keep bashing the same commands over and over. You spend less time setting up and more time actually analysing.
Yes, I’ve thrown things in the file that could go in the global config, but I like to have everything in one place for ease of tweaking and I know that I can pass the whole thing to someone else and have confidence that it’ll work on their box too.
Getting Specialised
As you can specify the command file you need at each run, I quickly found that having multiple command packages on hand was really useful and built very specific files to zero in on the areas I was interested in.
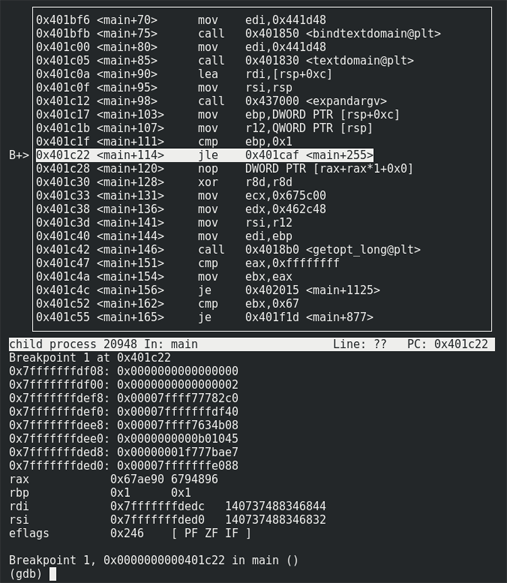
Here’s an example that breaks on a jump, displaying the stack, some registers and the state of the flags.
set disassembly-flavor intel
layout asm

focus cmd
winheight cmd 20
set height 0

define stackdump
set $offset=56
	while $offset > -1
		x/gx $rsp+$offset
		set $offset=$offset-8
	end
end

# Dump the top of the stack and relevant registers at each break
define hook-stop
	stackdump
	info registers rax
	info registers rbp
	info registers rdi
	info registers rsi
	info registers eflags
end

# breakpoints
break *0x401c22

run
This removes the need to ‘drive’ gdb. You just invoke it, get the information you need and shut it down again.
Building command files does take a while, but it is well worth putting the time in. You quickly build up a library of tools that complement your workflow, keep gdb from getting the way and will help you work faster.